How to Improve Your QR Code Conversion Rate in 2026
A QR Code conversion rate measures how often scanners complete a target action after the scan. Optimizing it means improving the full path from physical notice to scan to mobile experience to conversion, not scan counts alone.
Use Dynamic QR Codes from QRCG by Bitly to define goals, measure scan-to-action performance, and improve results at every stage of the funnel.
Key takeaways
- Measure scan-to-action, not scans alone. Treat a scan as the click and the conversion as the business outcome.
- Map every QR Code to a funnel stage. Top-of-funnel (TOFU) earns attention. Middle-of-funnel (MOFU) builds trust. Bottom-of-funnel (BOFU) removes friction, and loyalty drives repeat engagement.
- Use Dynamic QR Codes with clear calls to action (CTAs). Editable destinations and scan analytics let you test offers, pages, and placements without reprinting.
- Benchmark by action type and context. Menu or Wi‑Fi utility scans convert differently from lead forms and checkout flows.
- Connect QRCG scan data to Google Analytics 4 (GA4) with UTM parameters. Attribution closes the loop from physical placement to revenue or leads.
What is a QR Code conversion rate?
A QR Code conversion rate is the percentage of people who scan your code and then complete a defined goal. That goal might be a sale, form submit, booking, app install, or signup.
It is not the same as how many people notice or scan the code. Scan rate (sometimes called scan-through rate) measures exposure to scan: How often people who see the code actually scan it. True conversion rate measures scan to action: How often scanners complete your goal afterward.
Both metrics matter for different reasons. High scans with low conversions usually point to a landing page, offer, or mobile experience problem. Low scans with high conversions usually point to weak placement, size, contrast, or CTA copy. Scan rate diagnoses the physical creative, while conversion rate diagnoses what happens after the camera unlocks.
Conversion rate optimization for QR Codes still involves encouraging a specific action, but the path begins offline. Goals can be direct sales or softer CTAs such as webinar registrations, quote requests, newsletter sign-ups, reviews, or loyalty enrollments. Define the goal before you print so every design, destination, and metric decision supports the same outcome.
How do you calculate QR Code conversion rate?
Use this core formula:
QR Code conversion rate = (Completed actions ÷ Unique scans) × 100
For example, 87 form completions from 300 unique scans equals a 29% conversion rate. Prefer unique scans as the denominator when the same device may rescan the same code. That keeps one curious scanner from inflating your traffic base. Total scans still help you understand volume and curiosity, but unique scans usually produce a cleaner conversion story.


When you also track sessions in analytics, add these secondary checks:
- Scan-to-session rate = Sessions ÷ Scans: Flags broken redirects, blocked destinations, or pages that never load.
- Session conversion rate = Conversions ÷ Sessions: Flags landing-page friction after the visit starts.
Together, those three views show where the funnel breaks. If unique scans are strong but sessions are weak, fix redirects and page speed first. If sessions are strong but conversions lag, fix the offer, form length, or message match.
Static QR Codes cannot support this full loop. They open a fixed destination without the scan dataset or the post-print flexibility that conversion work requires. Dynamic QR Codes plus a tracked destination can. For the full attribution stack, follow a complete QR Code conversion tracking setup.
What is a good QR Code conversion rate? Benchmarks for 2026
“Good” depends on the action and context. Utility actions like menus or Wi‑Fi convert at far higher rates than cold checkout flows because the scan often is the task.
Treat the ranges below as directional patterns from industry tracking write-ups, not universal targets or proprietary QRCG data. Always benchmark against your own placements, offers, and baselines first. A 12% lead-form rate can be excellent on a cold sidewalk poster and weak on a high-intent event badge.
| Action type | Directional post-scan conversion pattern | Context notes |
|---|---|---|
| Utility access (menu, Wi‑Fi) | Often much higher than marketing goals | Scan is the task |
| Contact save / event check-in | Typically stronger than cold lead gen | High intent, low friction |
| Lead form / feedback | Often mid-teens to mid-twenties when forms stay short | Form length and offer quality dominate |
| App install | Usually lower than simple form fills | Extra store friction |
| Direct checkout | Often the lowest marketing band | Cold physical traffic converts lower |
Owned and third-party research helps set expectations around adoption and measurement priorities. Bitly’s QR Code research shows marketers prioritize unique users, conversion rate, and total scans. They also deploy codes across channels like email, packaging, events, print, and in-store.
That channel mix matters. A package code and a billboard code rarely share the same conversion band, even when the brand and offer match.
79% of consumers say they are more likely to buy when a scannable QR Code delivers the product information they want (GS1 US, 2025). That is a consideration-stage proof point, not a guarantee of checkout conversion. It still shows why educational destinations can move revenue.
TEAM LEWIS research highlights heavy QR Code usage among Gen Z and Millennials and the need for a clear incentive, CTA, and mobile-optimized destination. If your audience is younger or already phone-first, weak CTAs and slow pages waste the demand you already paid to attract.
When comparing QR Code campaign performance, hold the action type constant. Compare menu codes to menu codes, lead forms to lead forms, and checkout flows to checkout flows. Then layer placement, creative, and offer on top, to improve the right lever.
Map QR Codes to the marketing funnel
QR Codes work at every stage when the destination matches the shopper’s intent. Assign each code a funnel job before you design the creative, print the asset, or write the CTA.
| Funnel stage | Goal | Strong QR destinations | Success metrics |
|---|---|---|---|
| Awareness (TOFU) | Earn attention | Brand video, interactive experience, contest, social profile | Unique scans, branded search lift, content views |
| Consideration (MOFU) | Build trust | Product details, demos, comparisons, FAQs, reviews, sustainability data | Engagement rate, time on page, content downloads |
| Conversion (BOFU) | Drive action | Checkout, booking, trial, pre-filled form, offer claim | Conversion rate, cost per conversion, revenue per scan |
| Loyalty | Retain and expand | Loyalty join, refill/reorder, referral reward, support how-to, feedback | Repeat scans, retention, referrals, customer satisfaction (CSAT) |
Awareness (TOFU)
At the top of the funnel, QR Codes should earn attention with low-friction content rather than a hard sell. Place codes where discovery happens: out-of-home, events, packaging, posters, and pop-up booths.
Frame the CTA around a clear reward, like “Scan for the film” or “Scan to enter.”
Success looks like unique scans, content views, and branded search lift, not checkout volume on day one. If you force a long form too early, people learn to ignore the next code they see from your brand.
Consideration (MOFU)
In the middle of the funnel, codes should build trust with product education and proof. Packaging and shelf codes work well for ingredients, demos, comparisons, FAQs, reviews, and sustainability details.
Shoppers reward that transparency. 79% of consumers are more likely to buy when a scannable QR Code provides the product information they want (GS1 US, 2025). Link to proof content first unless intent is already high enough for a direct offer. Measure engagement rate, time on page, and content downloads before you judge the code a failure on revenue alone.
Conversion (BOFU)
At the bottom of the funnel, remove friction so scanners can act in one clear step. Use one primary CTA, mobile-fast pages, pre-filled forms, and direct booking or cart paths.
Dynamic QR Codes matter here because offers change. You can swap destinations, seasonal discounts, or landing pages without reprinting posters, packaging, or window decals. Keep the printed promise stable (“Scan to book today”) while you test which booking page or incentive converts best.
Loyalty (after the sale)
After the sale, QR Codes should retain and expand the relationship. Put codes on receipts, packaging inserts, and service materials that open loyalty enrollment, refill or reorder flows, referral rewards, support how-tos, or feedback surveys.
Feedback QR Codes make it easy to collect experience data in print or digital media. Track repeat scans, retention, referrals, and satisfaction, not only first-time conversion. A lower conversion rate on a loyalty join can still beat a higher one-time coupon scan if it creates ongoing value.
Brand-style mini examples
Use short, stage-matched destinations like these composite patterns:
- TOFU: A local brand places a code on a pop-up booth that opens a short brand film plus contest entry. The goal is attention and an email opt-in, not an immediate sale.
- MOFU: A consumer packaged goods (CPG) carton code opens ingredients, sourcing notes, and a how-to video. Shoppers who want more detail can deepen trust before they return to the shelf decision.
- BOFU: A service business adds a window-poster code to a same-day booking form with a single, thumb-friendly CTA. Dynamic editing lets the team change appointment offers without new print runs.
- Loyalty: A hospitality receipt code opens points enrollment and a short review request. Repeat guests can reorder, refer a friend, or share feedback in one scan.
The conversion lift comes from matching intent, reducing steps, and measuring the right success metric for the stage.
Strategies that improve QR Code conversion rates
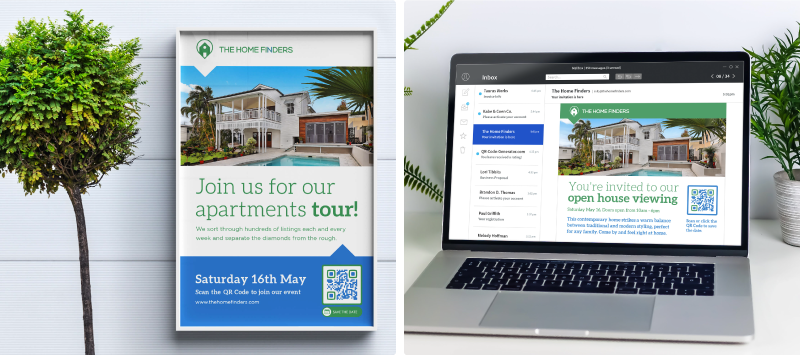
You improve QR Code conversion rates when you treat every placement like a tracked campaign. Test one variable at a time, design for the scan moment, match the mobile experience to the promise, and keep attribution clean across channels. Align each QR Code type and campaign with the funnel stage you chose above.
Track every placement like a campaign
You need Dynamic QR Codes, unique codes (or unique UTM content values) per placement, and consistent campaign naming. Without that structure, you cannot tell which poster, package, or event drove results.
Start with scan metrics in QR Code tracking and QR Code analytics. Track total scans, unique scans, location, device or operating system (OS), and time. Then connect downstream conversions to compare campaigns on scans, sessions, conversion rate, cost per conversion, and revenue per scan.
A simple comparison table like this helps teams act faster:
| Campaign / placement | Unique scans | Sessions | Conversions | Conversion rate | Notes |
|---|---|---|---|---|---|
| Window poster A | CTA + offer | ||||
| Packaging run B | Stock-keeping unit (SKU) / region | ||||
| Event badge C | Audience intent |
Fill the cells weekly. Kill weak placements, scale winners, and document the creative or offer difference that moved the number.
A/B test creative, CTA, and destination
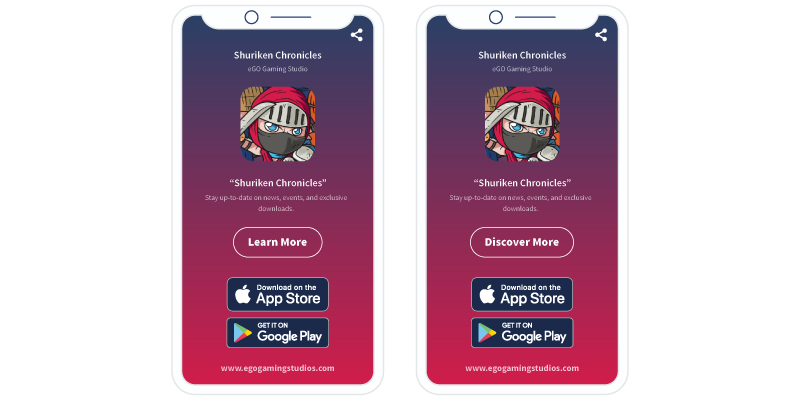
A/B testing compares two versions of a campaign element to see which performs better. Test one variable at a time: frame CTA copy, color or logo treatment, offer, or landing page.
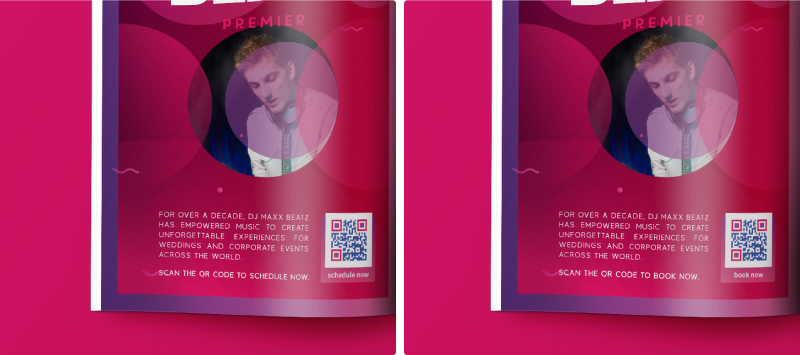
Dynamic destinations unlock post-print tests because the printed code can stay the same while the experience changes. Pair creative tests with QR Code landing page experiments on headline, form length, and incentive. Small changes, like “Scan for 15% off today” versus “Scan me,” often move scan rate first and conversion rate second.
Design for the scan moment
If people cannot scan quickly, conversion rate never gets a chance. Size codes for viewing distance (about 2 × 2 cm minimum for close scans; scale up for posters and out-of-home (OOH)). Protect the quiet zone, maintain high contrast, and place codes at a natural phone height to avoid glare.
Brand the code with colors, a logo, and a frame CTA while preserving scannability. For details, see minimum QR Code size and how to create high-performing QR Codes.
Scan-moment checklist
- Size for the real viewing distance, not the design mockup.
- Keep the quiet zone and contrast intact after branding.
- Place the code where hands and eyes already go.
- Write a specific CTA on the frame or surrounding layout.
- Test on multiple devices, lighting conditions, and distances before print.
Build mobile landing experiences that match the promise
Every scan should open a page that delivers exactly what the poster, package, or ad promised. Use one goal per page, an answer-first headline, and a thumb-friendly CTA. Keep load times fast and match the message from physical creative to screen.
Homepages and multi-path navigation kill post-scan momentum. Build or refine destinations with QR Code landing pages so the next step is obvious on a phone. If the print says “book today,” the first screen should open the booking path, not a brand story carousel.
Use multi-channel QR Codes without muddying attribution
Tell the same story across print and digital, but give each channel its own tracking parameters. A brochure, event badge, email, and packaging run can share creative themes while staying measurable as separate placements.
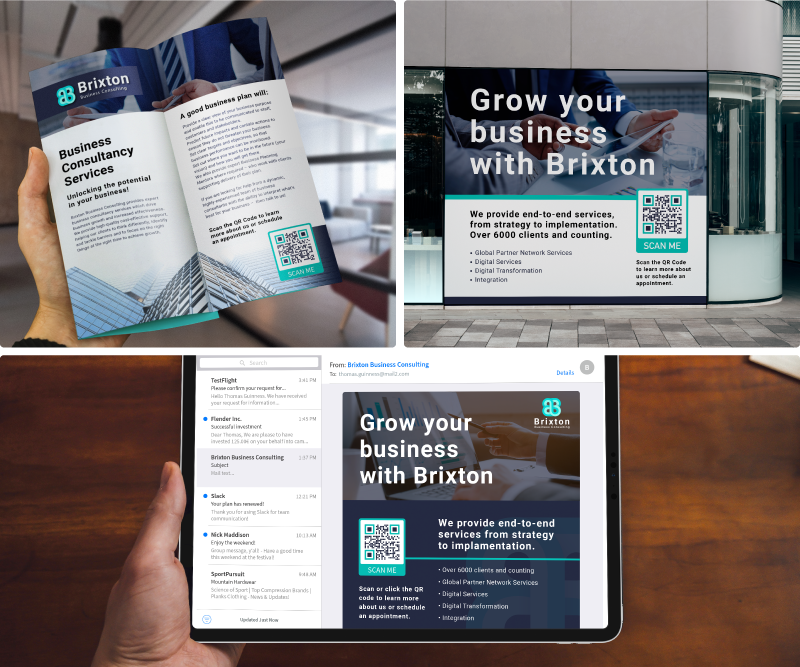
Segment campaign details by medium, print run, and duration. Then compare conversion rate and volume by channel so you can scale what works and retire what doesn’t. Avoid guessing from blended totals. Multi-channel reach only helps if you can still answer which touchpoint earned the action.
Tips checklist for higher-converting QR Codes
- Size for distance: at least 2 × 2 cm for close scans; scale up for posters and OOH.
- Brand the code: colors, logo, and frame that still keep high contrast.
- Write a specific CTA: “Scan for 15% off today” beats “Scan me.”
- Promise-match the destination: no surprise homepages.
- Prefer Dynamic QR Codes: edit, retarget offers, and measure.
- Tag URLs with UTM parameters: connect scans to GA4 key events.
- Test before print: multiple devices, lighting, and distances.
- Review weekly: kill weak placements; scale winners.
Connect scans to revenue with QRCG by Bitly
QRCG is the focused QR Code generator for creating branded Dynamic QR Codes, reviewing scan analytics, and updating destinations after print. Use it when you need a professional code fast, plus the edit-and-measure loop that conversion optimization requires.
A practical workflow looks like this:
- Create a Dynamic QR Code for the campaign goal.
- Customize brand colors, logo, and CTA frame.
- Add a UTM-tagged destination or mobile landing experience.
- Place the code in the market across the right funnel stage.
- Read scans in your dashboard by location, device, and time.
- Optimize the landing experience and offer based on results.
- Measure conversions and revenue impact in your analytics platform.
That workflow keeps physical media flexible. You can launch early, fix a weak destination later, and still preserve the printed asset. For campaign planning beyond a single code, browse marketing campaigns with QR Codes and the broader solutions library.
Turn more scans into customers
Define conversion as scan-to-action, not vanity scan volume. Benchmark by action type and context, and give every QR Code a clear role in the funnel. Run a continuous optimization loop with Dynamic QR Codes, clean UTM parameters, and analytics.
Scans are the start of the journey. The brands that win treat the mobile experience, offer, and measurement stack as carefully as the printed creative. Improve each step from notice to action, and more of the attention you already earned becomes customers, leads, and loyal fans.
Sign up for QRCG to build branded Dynamic QR Codes, track every scan, and improve conversion rates across your funnel.
Frequently asked questions
What is a good QR Code conversion rate?
A good QR Code conversion rate depends on the action you measure. Utility flows like menus or Wi‑Fi often convert at very high rates because the scan is the task. Marketing actions such as lead forms usually convert better when the offer is clear, and the form stays short.
Direct checkout flows often sit lower. Benchmark against your own baselines by placement and offer, not a single universal number.
How do you calculate QR Code conversion rate?
Divide completed actions by unique scans, then multiply by 100. For example, 40 sales from 500 unique scans equals an 8% conversion rate. Pair that figure with scan volume and cost data so you can judge return on investment (ROI), not vanity engagement.
What is the difference between scan rate and conversion rate?
Scan rate measures how often people who see a code actually scan it. Conversion rate measures how often scanners complete your goal afterward. You need both: scan rate diagnoses physical creative and placement, while conversion rate diagnoses the mobile experience and offer.
How do QR Codes support each stage of the marketing funnel?
At the top of the funnel, codes drive awareness, content, and campaigns. In the middle, they deliver product details, proof, and education. At the bottom, they shorten paths to checkout, booking, or signup. After the sale, they support loyalty, feedback, and referrals.
Match the destination to the stage so you never ask for the sale too early or bury the offer too late.
How can I improve QR Code conversions without reprinting materials?
Use Dynamic QR Codes so you can change the destination, offer, or landing page while the printed code stays the same. Run A/B tests on page copy, form length, and incentives, and keep UTM parameters consistent so QR Code conversion tracking shows which variant wins.
Do I need Dynamic QR Codes to measure conversion rate?
Yes, if you want reliable scan analytics and editable destinations. Static QR Codes can open a page, but they do not give you the scan dataset or post-print flexibility that conversion optimization requires. Create Dynamic QR Codes in QRCG, tag destinations, and connect downstream events in your analytics platform.


QR Code Generator
Your all-in-one QR Code marketing platform
Now you can fully customize your QR Codes with your brand colors and company logo, get scan statistics, and even edit the content after print.